This study demonstrates that more attention should be paid to the calibration data as a source of uncertainty in model predictions. It also provides evidence for either a wider adoption of modern sensors providing high-frequency data, or for increasing the grab sampling frequency to reduce the uncertainty of loading estimates, particularly in rivers with flashy flow regime such as the Vantaanjoki River.
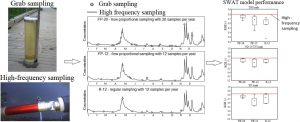
With conventional water quality monitoring based on grab sampling, usually carried out once a month, it is quite challenging to obtain reliable sediment and nutrient loading estimates, which is a pre-requisite for testing of water quality models. Despite the growing availability of high-frequency water quality monitoring data obtained by using modern sensors, their use in the calibration of water quality models is still limited. The main objective of this study is to evaluate six years of continuous, high-frequency water quality monitoring data set from a case study carried out in a medium-sized, boreal catchment in southern Finland to be used as a source for the calibration and testing of the Soil & Water Assessment Tool (SWAT). This objective is accomplished by developing a set of ‘sub-sampling’ scenarios focused on quantifying the effect of the sampling frequency (12 vs. 26 samples per year) and strategy (regular vs. flow-proportional sampling) on the model performance and output uncertainty. The goodness-of-fit of the model calibrated against high-frequency data (‘benchmark’), evaluated using the Kling-Gupta Efficiency index for total suspended solids (TSS), nitrate and total nitrogen (NO3-N and TN) and total phosphorus (TP) daily loads ranged between 0.76 and 0.83 (0.69 and 0.73 in validation period). Overall, the model calibrated against low-frequency data performed worse when evaluated against high-frequency data and compared with the benchmark model for each of the studied water quality parameters. The results show that increasing the sampling frequency from 12 to 26 samples per year leads to an improvement in the model performance, particularly for TSS and TP loads.
In contrast to the sampling frequency, the evidence for the effect of the sampling strategy on the model performance was much weaker. The model output uncertainty due to different realizations of sub-sampling scenarios was high for four analysed output indices: basin-averaged, long-term average annual values of soil erosion rate, denitrification rate, NO3-N yield and soluble P yield.